
1.4.4How does velocity change?
Acceleration
Problems 1-162 and 1-163 each started with a rate of change. For example, Dijin’s velocity describes how his position changes, while the rate in problem 1-163 focused on how the number of words being read changes. Now consider how these rates of change change themselves!
Dijin’s velocity in meters/min is shown again in the graph below. Carefully describe how his velocity changes.
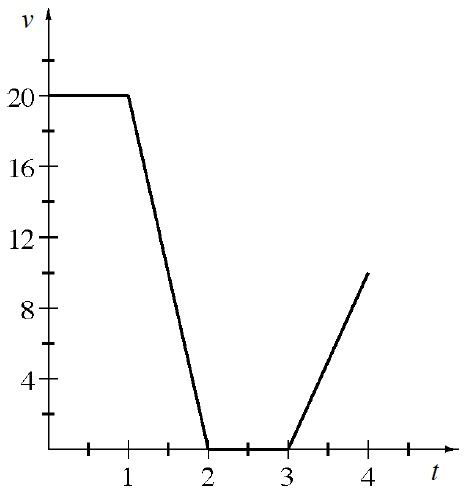
The rate at which the velocity changes is called acceleration. If Dijin’s velocity is measured in meters per minute, what are the units of Dijin’s acceleration? Explain.
Write a piecewise-defined function to represent Dijin’s acceleration for
. What happens to Dijin’s velocity when his acceleration is zero?
During what interval is Dijin’s acceleration positive? How do you know? Describe Dijin’s motion during this interval.
Describe what acceleration will tell you about Dijin’s motion.
The graph below shows the velocity of a particle that is moving up and down the
.png)
Use the velocity graph to decide at which point(s) the each of given events below happens.
Velocity is positive.
Speed is greatest. (Note—it may help to sketch a speed graph.)
Acceleration is negative.
Velocity is zero.
Determine if each of the following conjectures are always true, sometimes true, or never true. Then provide examples and/or counterexamples from the velocity graph to support your claim.
Conjecture 1: When velocity is increasing, the particle is speeding up.
Conjecture 2: When velocity is zero, the particle changes directions.
Conjecture 3: When velocity changes sign, the speed of the particle decreases.
Conjecture 4: When velocity is at a maximum or minimum, acceleration is zero.
Betsy rode her bike and generated the velocity graph below where
.png)
Calculate the area under
. What does this area represent? The area under Betsy’s velocity curve represents displacement, not total distance. Sketch another graph such that the area under the curve represents represents the total distance that Betsy traveled throughout the interval
. This will no longer be a velocity graph, so how should you label the -axis of this graph? Which of the graphs below could represent Betsy’s distance from home? There may be more than one answer.
(A)
.png)
(B)
.png)
(C)
.png)
(D)
.png)
If Betsy’s initial position was
miles from her home, which graph represents her position as a function of time? How far from home was she at ?
The graph below shows the velocity of a bug crawling back and forth along the
.png)
Describe the motion of the bug.
What happens to the bug’s motion when the velocity is negative?
Approximately how far did the bug travel in the first
minutes? Approximate the bug’s displacement during the first
minutes. Approximate the total distance traveled by the bug during the first
minutes. Sometimes the displacement equals the total distance. Under what conditions are these measurements the same?
Jessica, Yoo, and Carl are afraid of bugs. They want to know the bug’s position on the
-axis at . Jessica thinks the bug is at . Yoo says the bug is at . Carl says that there is not enough information to answer the question. Who is correct? Explain. If the bug’s initial position at
is , where is the bug at ?
.png)
Positive velocity with negative acceleration.
Negative velocity with positive acceleration.
Positive velocity with no acceleration.
Zero velocity with a negative acceleration.
At one point Rajeesh was falling while slowing down. Is the velocity positive or negative? What about the acceleration?
The Vocabulary of Motion
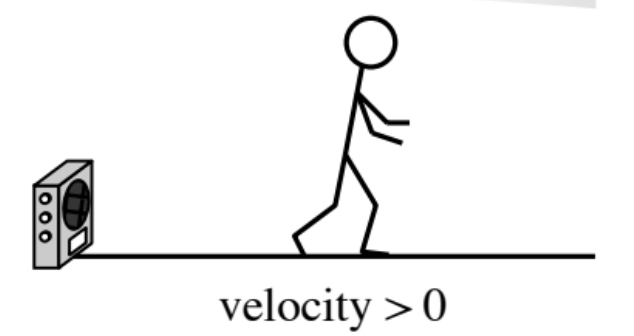
As an object moves, its position with respect to its starting place changes. The rate of this change is the velocity of the object. If the distance is increasing, the object is moving away from the starting place and the velocity is positive. Likewise, if the distance is decreasing, the object is moving toward the starting place and the velocity is negative. When motion is stopped, the velocity is zero. If the motion is vertical, traditionally up is positive.
When the direction of the motion is not an issue, the rate of motion can be called speed. Speed is always positive and is the absolute value of the velocity.
The acceleration is the rate of change of the velocity of the object. The acceleration measures the rate at which something is “speeding up” or “slowing down.” If the acceleration is zero, then the velocity is constant.
.png)
When the displacement is divided by total time, the result is the average velocity. Similarly, when the total distance is divided by total time, the result is the average speed.
.png)

The graph below represents the velocity of an object as a function of time. Trace it on your paper. Homework Help ✎
.png)
Put a star (*) at the point where velocity is the greatest.
With another color, sketch a graph of the speed on the same set of axes.
Indicate with a double star (**) the position where speed is the greatest.
Explain why the greatest velocity and the greatest speed do not occur at the same position.
Sketch a new graph where speed and velocity have the same maximum value.
Marni loves pancakes and likes to eat them in a tall stack. Assume that she always makes
Last Saturday, Marni decided to make square pancakes. If the largest pancake had an edge of
inches and each pancake had an edge inch shorter than the one below it, calculate the volume of pancakes Marni ate last Saturday. Next Sunday, Marni will make circular pancakes. Each pancake will have a diameter
inch smaller than the one below it and the smallest pancake will have a radius of inches. How much volume is Marni planning to eat?
.png)
Theo lost his graph again! Luckily, he used his distance-time graph to determine the following properties of his motion. Help him re-create a possible graph of his motion. 1-183 HW eToo. Homework Help ✎
Details:
He walked in one direction during the entire
seconds, except during the seconds when he was temporarily still. His average velocity was
feet per second. He began his motion
feet away from the motion detector.
As a cheetah runs, its velocity is given by
Sketch a graph of the cheetah’s velocity.
Approximately how fast is the cheetah running at
second? How did you get your answer? To catch prey, such as an antelope, the cheetah runs for
seconds. Approximately how far does the cheetah need to run to catch its prey? Describe your method. Annalou the Antelope standing
feet north of the Great Pond. The cheetah spots Annalou and runs south in a direct line towards her, catching her in exactly seconds. What was the cheetah’s initial position relative to the pond?
Rewrite
Write an equation for the end-behavior function of
Solve the following equations for all values of
The shaded region below represents a triangular “flag.” To help you visualize this, use the 1-188 eTool. Homework Help ✎
.png)
Imagine rotating this flag about its “pole” and describe the resulting three-dimensional figure. Draw a picture of this figure on your paper.
Calculate the volume of the rotated flag.
Let
What is
? Write an expression for
and simplify. If
, what are the possible values of ? Write an equation for
.